
خلاصہ: Ranked: Number of Trade Agreements Across 30 Economies


Ranked: Number of Trade Agreements Across 30 Economies
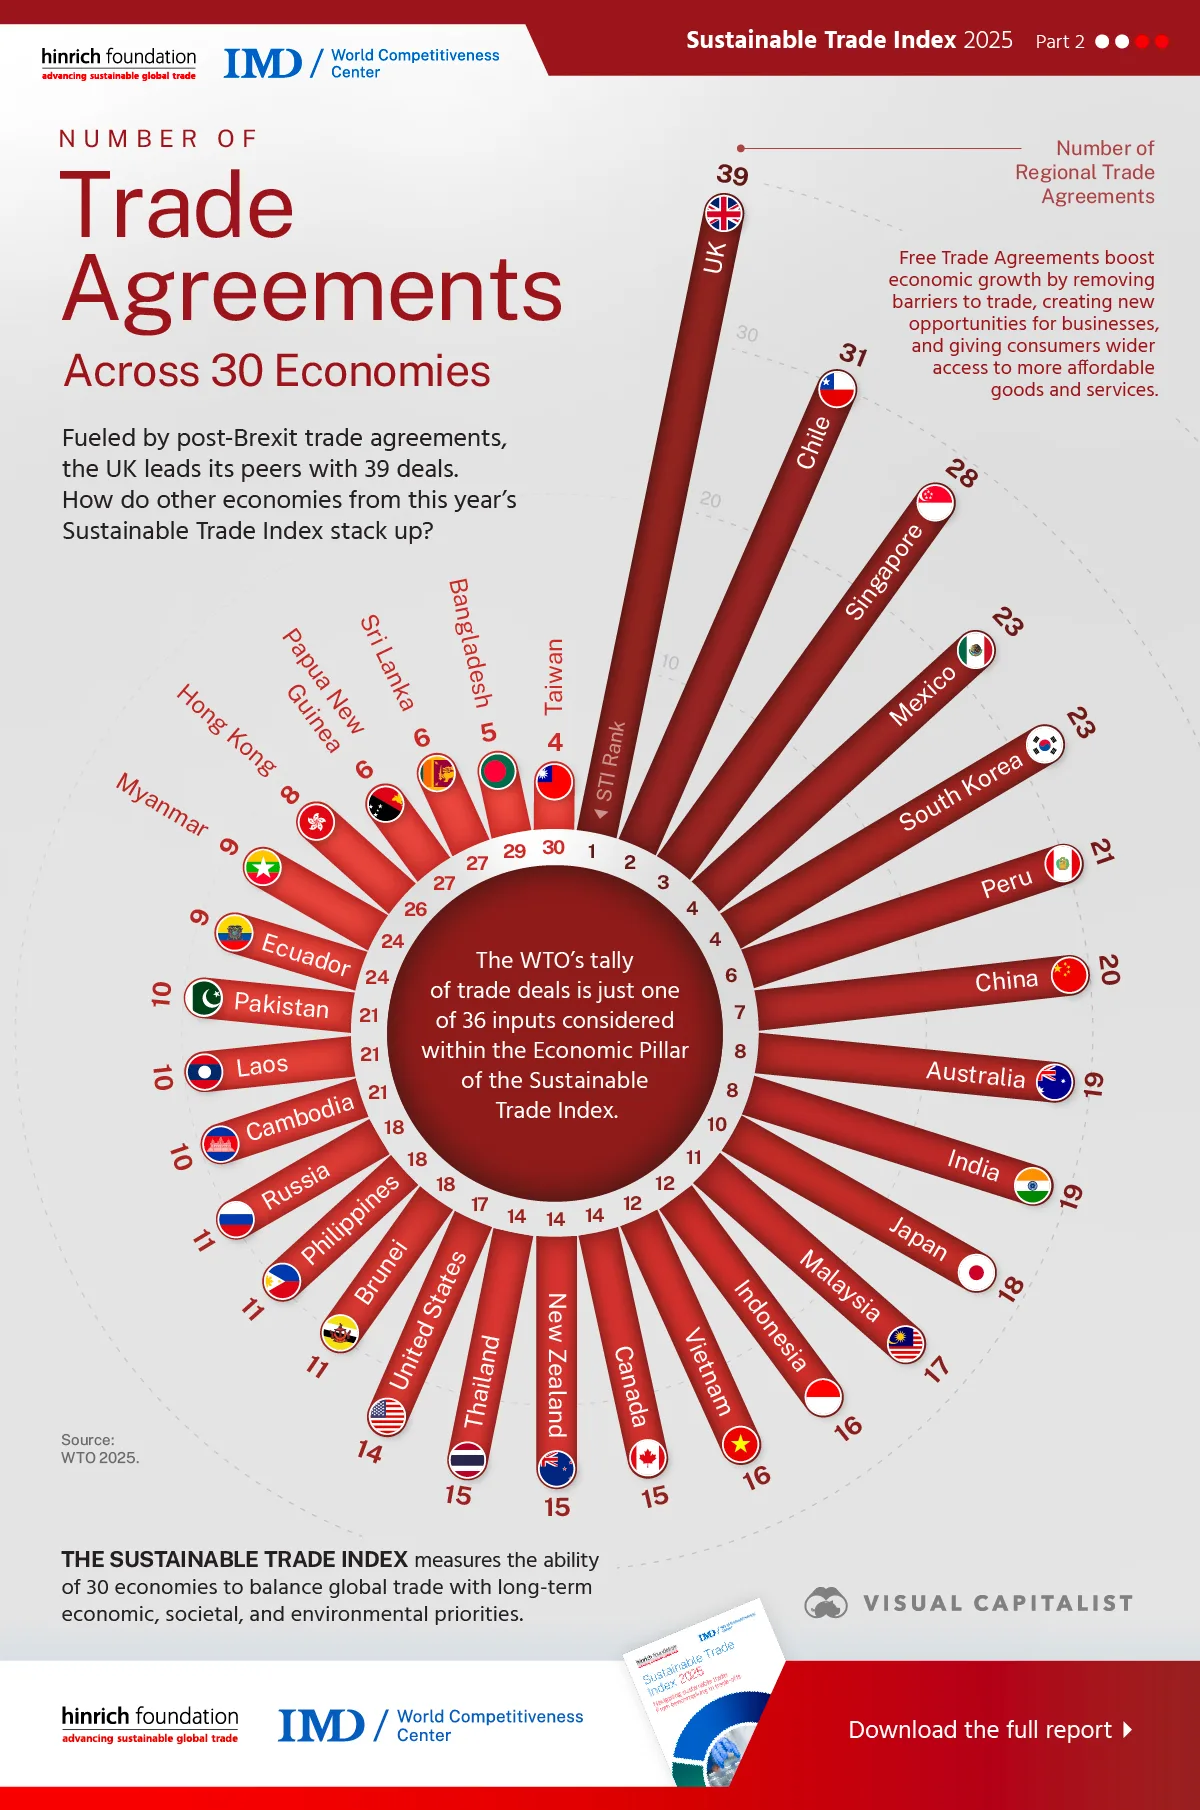
Fueled by post-Brexit trade agreements, the UK leads its peers with 39 deals. How do other economies from this year’s Sustainable Trade Index stack up?
This visualization, created in partnership with Hinrich Foundation, shows the number of trade agreements each country has in place, using data from the World Trade Organization.
The analysis comes from the 2025 Sustainable Trade Index (STI), which the Hinrich Foundation produced in collaboration with the IMD World Competitiveness Center.
What Is a Trade Agreement?
A trade agreement is a pact between countries that sets rules for cross-border trade. These deals lower barriers like tariffs and quotas, making trade more predictable and encouraging investment.
Types include bilateral (two countries) and multilateral (three or more). They range from free trade agreements that reduce tariffs, to customs unions with shared external policies, and economic unions (like the European Union) with deeper integration.
Countries with the Most Trade Agreements
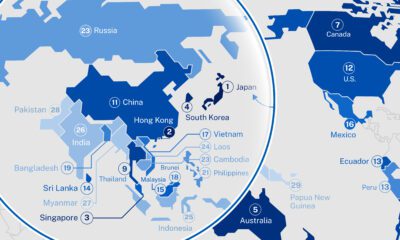
Of the 30 countries tracked by the STI, there is a huge range in terms of number of trade agreements.
The UK ranks first with 39 agreements. The country focused on building trade ties with non-EU nations after voting to leave the bloc in 2016.
| Rank | Country | Regional Trade Agreements (number) |
|---|---|---|
| 1 |  UK UK |
39 |
| 2 |  Chile Chile |
31 |
| 3 |  Singapore Singapore |
28 |
| 4 |  Mexico Mexico |
23 |
| 4 |  South Korea South Korea |
23 |
| 6 |  Peru Peru |
21 |
| 7 |  China China |
20 |
| 8 |  Australia Australia |
19 |
| 8 |  India India |
19 |
| 10 |  Japan Japan |
18 |
| 11 |  Malaysia Malaysia |
17 |
| 12 |  Indonesia Indonesia |
16 |
| 12 |  Vietnam Vietnam |
16 |
| 14 |  Canada Canada |
15 |
| 14 |  New Zealand New Zealand |
15 |
| 14 |  Thailand Thailand |
15 |
| 17 |  U.S. U.S. |
14 |
| 18 |  Brunei Brunei |
11 |
| 18 |  Philippines Philippines |
11 |
| 18 |  Russia Russia |
11 |
| 21 |  Cambodia Cambodia |
10 |
| 21 |  Laos Laos |
10 |
| 21 |  Pakistan Pakistan |
10 |
| 24 |  Ecuador Ecuador |
9 |
| 24 |  Myanmar Myanmar |
9 |
| 26 |  Hong Kong Hong Kong |
8 |
| 27 |  Papua New Guinea Papua New Guinea |
6 |
| 27 |  Sri Lanka Sri Lanka |
6 |
| 29 |  Bangladesh Bangladesh |
5 |
| 30 |  Taiwan Taiwan |
4 |
Chile ranks second with 31 agreements. Singapore follows in third place with 28 agreements. Both countries are small and depend heavily on imports.
Canada ranks 14th with 15 agreements. The U.S. ranks 17th with 14 agreements. Both countries sit in the middle of the pack.
Countries with the Least Trade Agreements
Several countries in the STI show limited openness to trade.
Taiwan ranks last with only 4 agreements. Bangladesh follows closely with 5 agreements. Sri Lanka and Papua New Guinea each hold 6 agreements.
Russia maintains 11 agreements despite heightened geopolitical tensions. It ranks 18th overall.
Explore the Sustainable Trade Index
This infographic was just a small subset of what the Sustainable Trade Index has to offer. To learn more, visit the Hinrich Foundation, where you can download additional resources including the entire report for free.
Visit the Hinrich Foundation to download the entire report, for free.
-
 Markets1 month ago
Ranked: The World’s Most Sustainable Economies in 2025
Based on the Hinrich Foundation’s 2025 Sustainable Trade Index, which economies are the most and least sustainable?
-
 Economy2 months ago
Ranked: Countries Losing the Most (and Least) from Trump’s Tariffs
Trump’s tariffs affect all major U.S. trading partners, but what matters is how each country’s tariffs compare to its competitors.
-
 Economy3 months ago
Charting How U.S. Tariffs Will Hit Key Products
U.S. tariffs have climbed to an average rate of 18.6%—the highest since 1933. But what does this mean for everyday consumers?
-
 Economy5 months ago
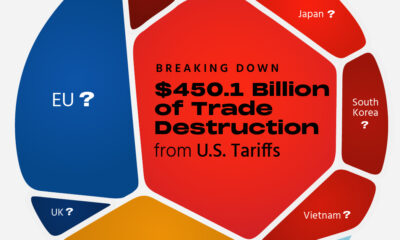
Breaking Down the $450 Billion of Trade Destruction from U.S. Tariffs
The UN has crunched the numbers projecting the ripple effects of Trump’s May 12th tariffs. Which economies are bracing for the biggest hits?
-
 Economy7 months ago
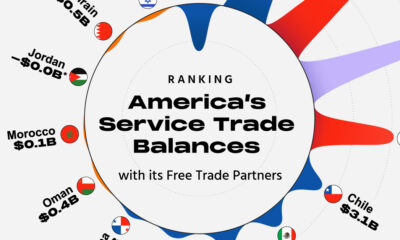
Ranked: America’s Services Trade Balances
America’s goods trade deficits have dominated headlines, but a critical part of the equation is being ignored: services trade.
-
 AI8 months ago
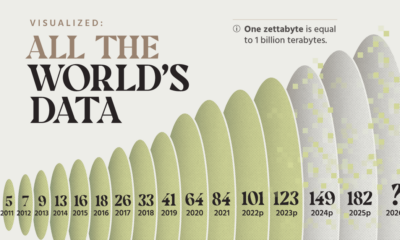
Visualized: All of the World’s Data
More data will be created, captured, and replicated in the next three years than in the rest of human history. But by how much?
-

 Economy9 months ago
Visualized: The Growing Opportunities in Global Trade Careers
Visual Capitalist has partnered with the Hinrich Foundation to explore the landscape of global trade and find out what students and trade professionals can do to…
-
 Green9 months ago
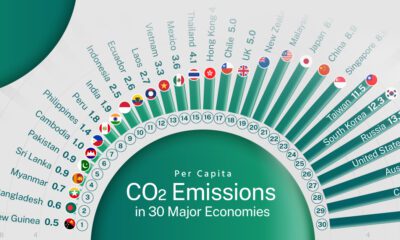
Ranked: CO₂ Emissions Per Person in 30 Economies
CO₂ emissions are reshaping the flows of international trade. Which countries have the highest and lowest CO₂ emissions per capita?
-
 Healthcare10 months ago
Mapped: Life Expectancy in Major Economies
Which countries have the highest and lowest life expectancies at birth?
-
 Markets1 year ago
Ranked: Government Debt Across Major Economies
Based on data from the IMF’s World Economic Outlook, which countries have the highest and lowest government debt ratios?
-
 Markets1 year ago
Ranked: The World’s Most Sustainable Economies in 2024
Based on the Hinri
SubscribeLoginPlease login to comment0 CommentsOldest