خلاصہ: Visualizing the State of World Debt in 2025
Visualizing the State of World Debt in 2025
See visuals like this from many other data creators on our Voronoi app. Download it for free on iOS or Android and discover incredible data-driven charts from a variety of trusted sources.
Key Takeaways
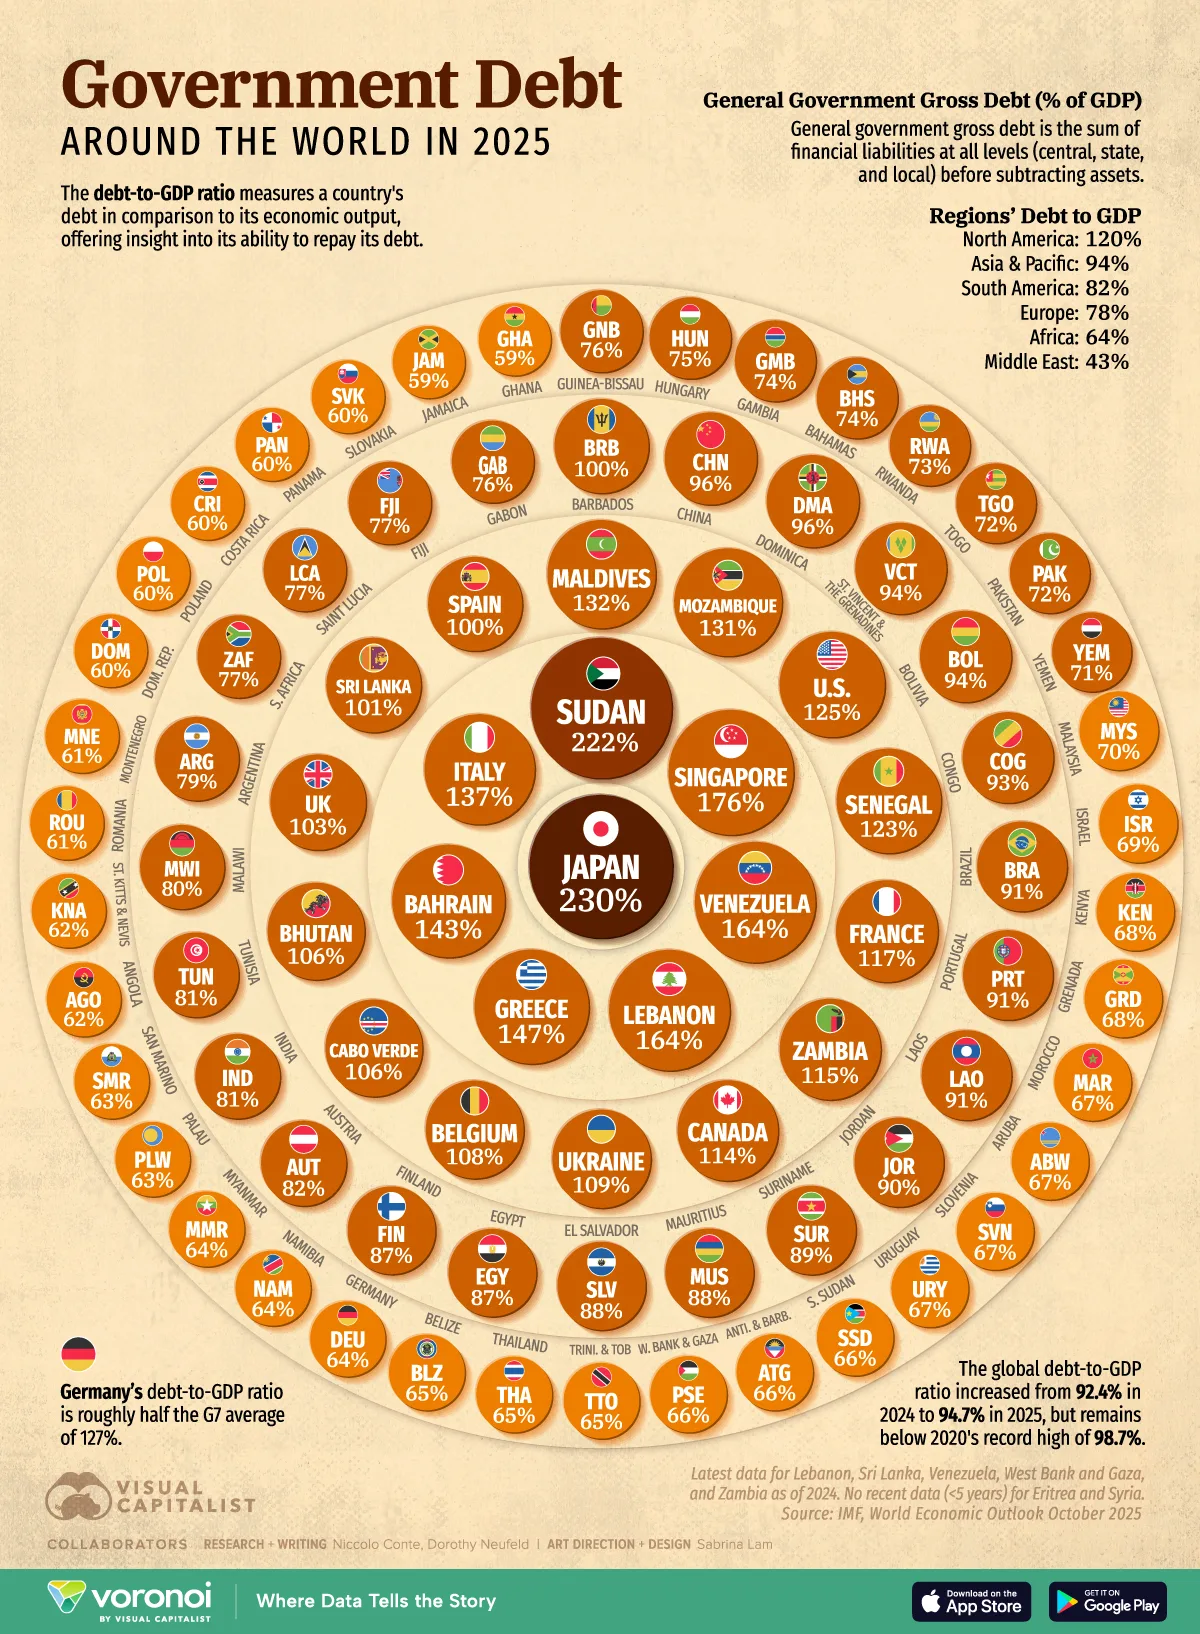
- World debt reached $111 trillion in 2025, equal to 94.7% of GDP.
- Japan, Sudan, and Singapore have the highest debt ratios globally, while the U.S. ranks in 11th with a 125% debt-to-GDP ratio.
World debt is so high that 23 countries are borrowing more than their GDP, including two countries owing more than double their annual economic output.
As debt-to-GDP ratios continue to swell, servicing them is getting more expensive. Strikingly, more than 3.4 billion people live in countries where net interest payments on public debt exceed education or health funding.
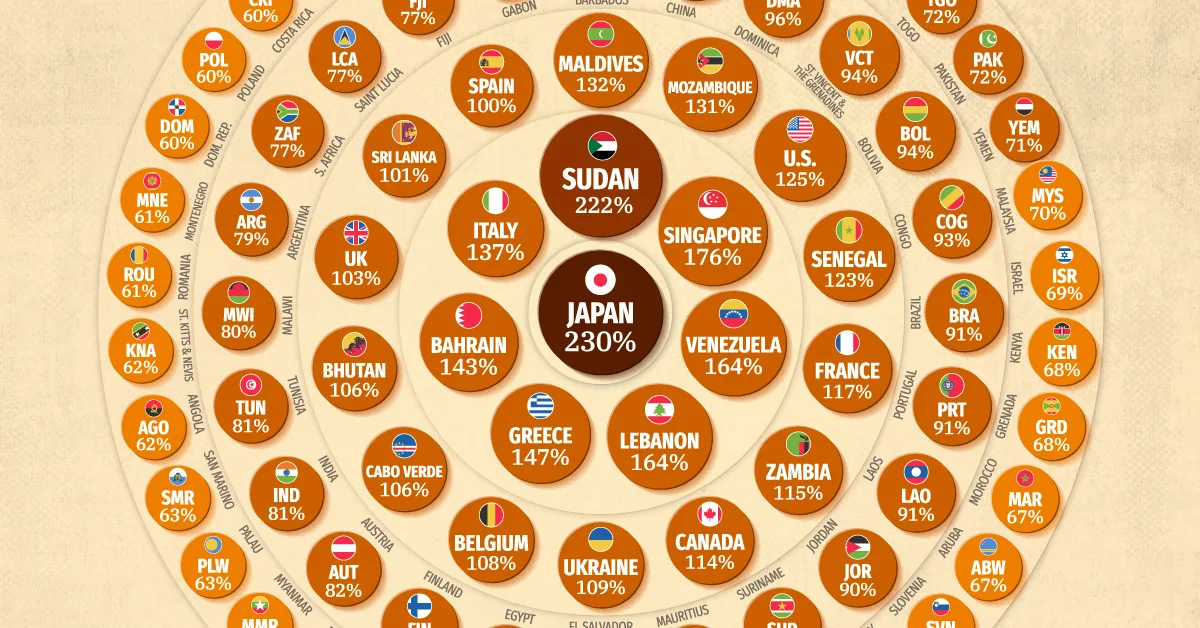
This graphic shows the countries with the highest debt-to-GDP ratios in 2025, based on data from the IMF’s latest World Economic Outlook.
World Debt Continues to Climb
Below, we rank countries by government debt as a share of GDP:
| Rank | Country | General Government Gross Debt (Percent of GDP) |
|---|---|---|
| 1 |  Japan Japan |
230% |
| 2 |  Sudan Sudan |
222% |
| 3 |  Singapore Singapore |
176% |
| 4 |  Venezuela Venezuela |
164% |
| 5 |  Lebanon Lebanon |
164% |
| 6 |  Greece Greece |
147% |
| 7 |  Bahrain Bahrain |
143% |
| 8 |  Italy Italy |
137% |
| 9 |  Maldives Maldives |
132% |
| 10 |  Mozambique Mozambique |
131% |
| 11 |  United States United States |
125% |
| 12 |  Senegal Senegal |
123% |
| 13 |  France France |
117% |
| 14 |  Zambia Zambia |
115% |
| 15 |  Canada Canada |
114% |
| 16 |  Ukraine Ukraine |
109% |
| 17 |  Belgium Belgium |
108% |
| 18 |  Cabo Verde Cabo Verde |
106% |
| 19 |  Bhutan Bhutan |
106% |
| 20 |  United Kingdom United Kingdom |
103% |
| 21 |  Sri Lanka Sri Lanka |
101% |
| 22 |  Spain Spain |
100% |
| 23 |  Barbados Barbados |
100% |
| 24 |  China China |
96% |
| 25 |  Dominica Dominica |
96% |
| 26 |  Saint Vincent and Saint Vincent andthe Grenadines |
94% |
| 27 |  Bolivia Bolivia |
94% |
| 28 |  Republic of the Republic of the Congo |
93% |
| 29 |  Brazil Brazil |
91% |
| 30 |  Portugal Portugal |
91% |
| 31 |  Laos Laos |
91% |
| 32 |  Jordan Jordan |
90% |
| 33 |  Suriname Suriname |
89% |
| 34 |  Mauritius Mauritius |
88% |
| 35 |  El Salvador El Salvador |
88% |
| 36 |  Egypt Egypt |
87% |
| 37 |  Finland Finland |
87% |
| 38 |  Austria Austria |
82% |
| 39 |  India India |
81% |
| 40 |  Tunisia Tunisia |
81% |
| 41 |  Malawi Malawi |
80% |
| 42 |  Argentina Argentina |
79% |
| 43 |  South Africa South Africa |
77% |
| 44 |  Saint Lucia Saint Lucia |
77% |
| 45 |  Fiji Fiji |
77% |
| 46 |  Gabon Gabon |
76% |
| 47 |  Guinea-Bissau Guinea-Bissau |
76% |
| 48 |  Hungary Hungary |
75% |
| 49 |  The Gambia The Gambia |
74% |
| 50 |  The Bahamas The Bahamas |
74% |
| 51 |  Rwanda Rwanda |
73% |
| 52 |  Togo Togo |
72% |
| 53 |  Pakistan Pakistan |
72% |
| 54 |  Yemen Yemen |
71% |
| 55 |  Malaysia Malaysia |
70% |
| 56 |  Israel Israel |
69% |
| 57 |  Kenya Kenya |
68% |
| 58 |  Grenada Grenada |
68% |
| 59 |  Morocco Morocco |
67% |
| 60 |  Aruba Aruba |
67% |
| 61 |  Slovenia Slovenia |
67% |
| 62 |  Uruguay Uruguay |
67% |
| 63 |  South Sudan South Sudan |
66% |
| 64 |  Antigua and Barbuda Antigua and Barbuda |
66% |
| 65 |  West Bank and Gaza West Bank and Gaza |
66% |
| 66 |  Trinidad and Tobago Trinidad and Tobago |
65% |
| 67 |  Thailand Thailand |
65% |
| 68 |  Belize Belize |
65% |
| 69 |  Germany Germany |
64% |
| 70 |  Namibia Namibia |
64% |
| 71 |  Myanmar Myanmar |
64% |
| 72 |  Palau Palau |
63% |
| 73 |  San Marino San Marino |
63% |
| 74 |  Angola Angola |
62% |
| 75 |  Saint Kitts and Nevis Saint Kitts and Nevis |
62% |
| 76 |  Romania Romania |
61% |
| 77 |  Montenegro Montenegro |
61% |
| 78 |  Dominican Republic Dominican Republic |
60% |
| 79 |  Poland Poland |
60% |
| 80 |  Costa Rica Costa Rica |
60% |
| 81 |  Panama Panama |
60% |
| 82 |  Slovakia Slovakia |
60% |
| 83 |  Jamaica Jamaica |
59% |
| 84 |  Ghana Ghana |
59% |
Japan takes the lead with a 230% debt ratio, declining from 235% in the IMF’s April forecast.
Despite this, Japan’s new prime minister is planning to revive ‘Abenomics’ through easy monetary policy and billions in subsidies. While this likely does not bode well for its debt pile, Japanese equities surged to record highs after the election.
War-torn Sudan follows next, with a 222% debt to GDP, followed by Singapore, at 176%.
In Europe, Greece’s debt burden is highest overall, at 147%—nearly double the region’s average. Italy follows next, with a 137% debt ratio, falling from 2020 highs of 155%.
Overall, America ranks 11th globally. As it stands, the current federal budget is projected to add $1.8 trillion each year to the $38 trillion debt pile. While the U.S. debt ratio is 125% today, it will likely only continue to rise.
Learn More on the Voronoi App 
To learn more about this topic, check out this graphic on debt to income by U.S. state.